Authors: Sarah Segel, Helena Graf, Alexander Tornede, Bernd Bischl, and Marius Lindauer
TL;DR
We propose to apply symbolic regression in a hyperparameter optimization setting to obtain explicit formulas providing simple and interpretable explanations of the effects of hyperparameters on the model performance.
HPO is great, but…
In the field of machine learning, hyperparameter optimization (HPO) plays a crucial role in finding the optimal configuration for a given model [Feurer and Hutter, 2019; Bischl et al., 2023]. However, the vast majority of existing HPO tools work in a black-box fashion without offering any form of explanation of the optimization process and the returned configuration, lacking insights and transparency. We believe that useful explanations can increase trust in HPO results for machine learning experts and help machine learning beginners to better understand the underlying algorithms and effects.
Symbolic Explanations to the Rescue!
To alleviate this situation and move towards a more human-centered and interpretable HPO process, we propose to employ symbolic regression to learn closed-form analytic expressions, or formulas, that capture the relationship between hyperparameter configurations and model performance. By applying genetic programming based symbolic regression [Augusto and Barbosa, 2000] to the meta-data collected during HPO, we obtain simple and interpretable explanations that provide insights into how the hyperparameter configuration influences the model performance.
The symbolic explanations obtained through our approach have several practical applications. First, providing insights into the HPO process can support data scientists and machine learning practitioners in their decisions when using and interacting with HPO tools. Second, obtaining explicit formulas and inspecting their properties could help researchers to better understand the HPO loss landscape [Pushak and Hoos, 2022; Schneider et al., 2022].
The overall process of our approach is visualized below and consists of the following steps:
- Run a Bayesian optimization based HPO tool and collect (a) the meta-data consisting of the evaluated configurations and their performance and (b) the final surrogate model.
- Learn a symbolic regression model on either (a) the collected meta-data, or (b) randomly sampled configurations, which are evaluated using the true cost function, or (c) randomly sampled configurations, whose performance is estimated using the surrogate model.
- Leverage the symbolic explanation of the underlying HPO loss landscape.
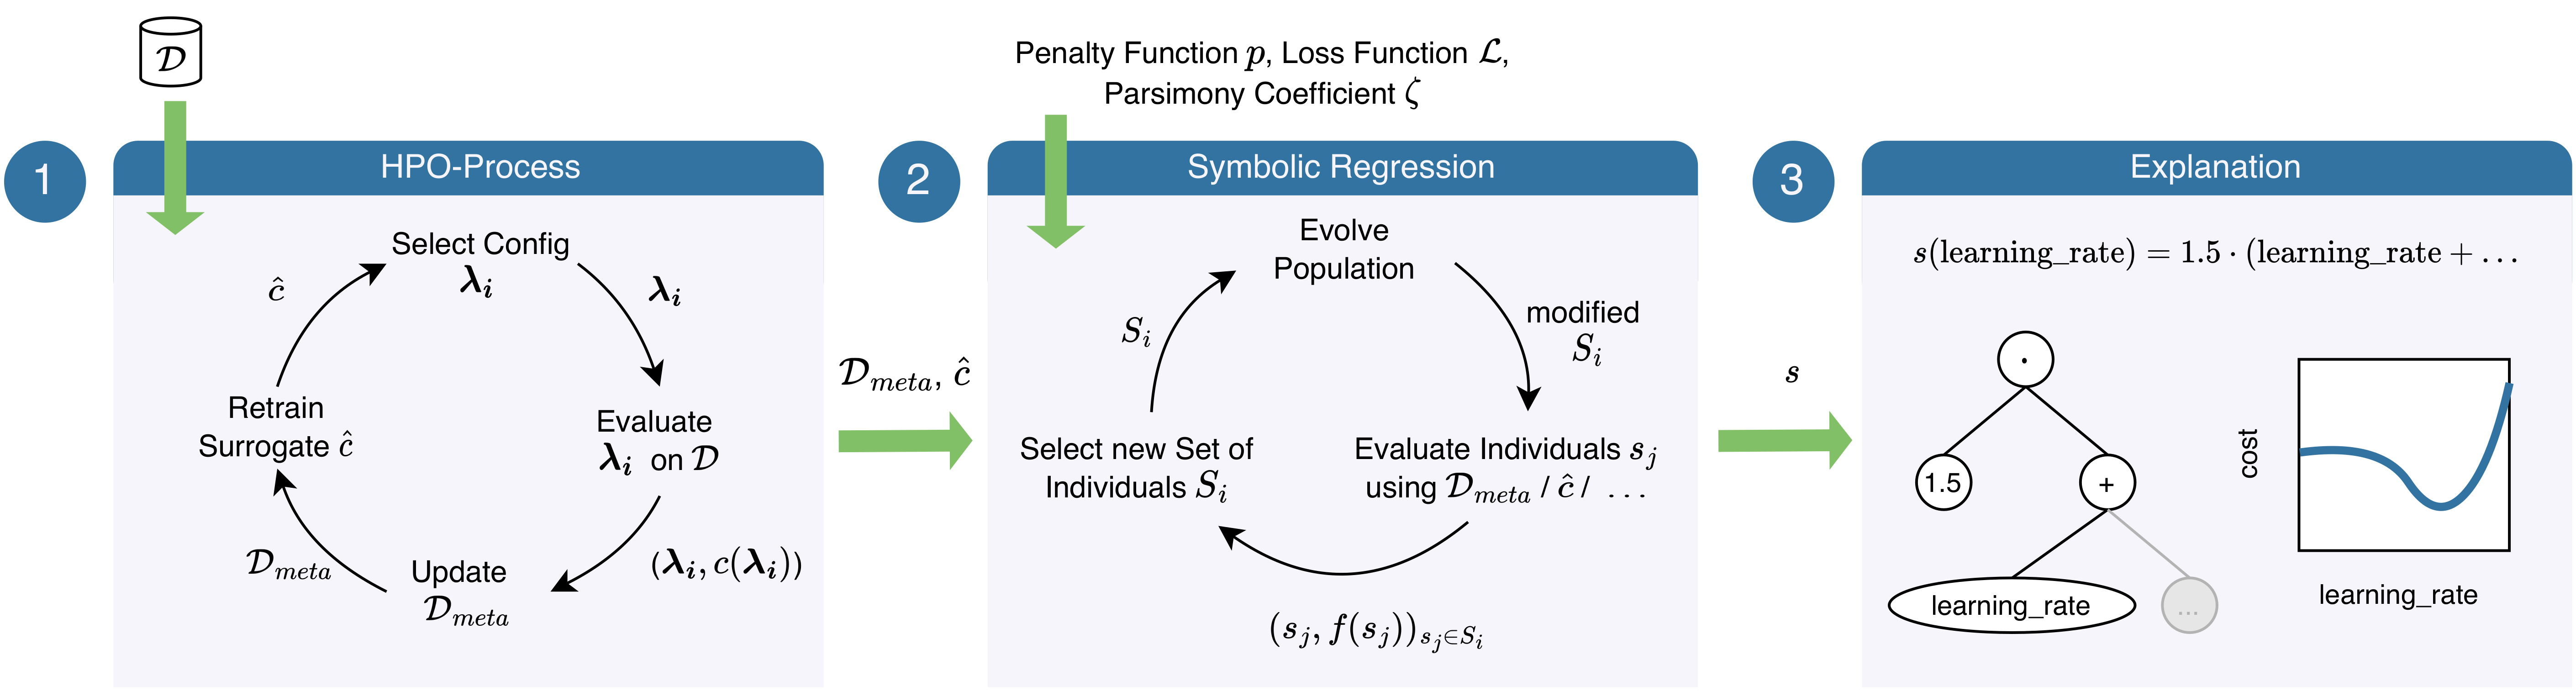
We show that naively applying symbolic regression does not yield an expression with high explanation power due to the bias in the meta-data used for training, which is caused by the HPO process’ sampling strategy. Instead, we suggest to leverage the surrogate model learned during the HPO process to predict the performance of randomly sampled points, and leverage those to fit the symbolic regression model. By penalizing longer formulas, symbolic regression furthermore allows the user to decide how to balance the accuracy and explainability of the resulting formulas. In order to deal with many hyperparameters, we propose to focus on the most important ones according to functional ANOVA [Hutter et al., 2014] and integrate out the rest using a partial dependence function, as proposed by Moosbauer et al. (2021).
Experiments and Results
To evaluate the effectiveness of our approach, we conducted extensive experiments using a range of models, hyperparameters, and datasets from the HPOBench benchmark, leveraging the HPO tool SMAC [Lindauer et al., 2022] as a basis for the evaluation.
The results demonstrate the faithfulness of the symbolic explanations, as well as their ability to provide simple explanations. We find that naively applying symbolic regression directly to meta-data collected during HPO is affected by the sampling bias introduced by Bayesian optimization, as recently observed for partial dependence plots as well [Moosbauer et al., 2021]. However, the true underlying loss landscape can be approximated by fitting the symbolic regression on the surrogate model trained during Bayesian optimization.
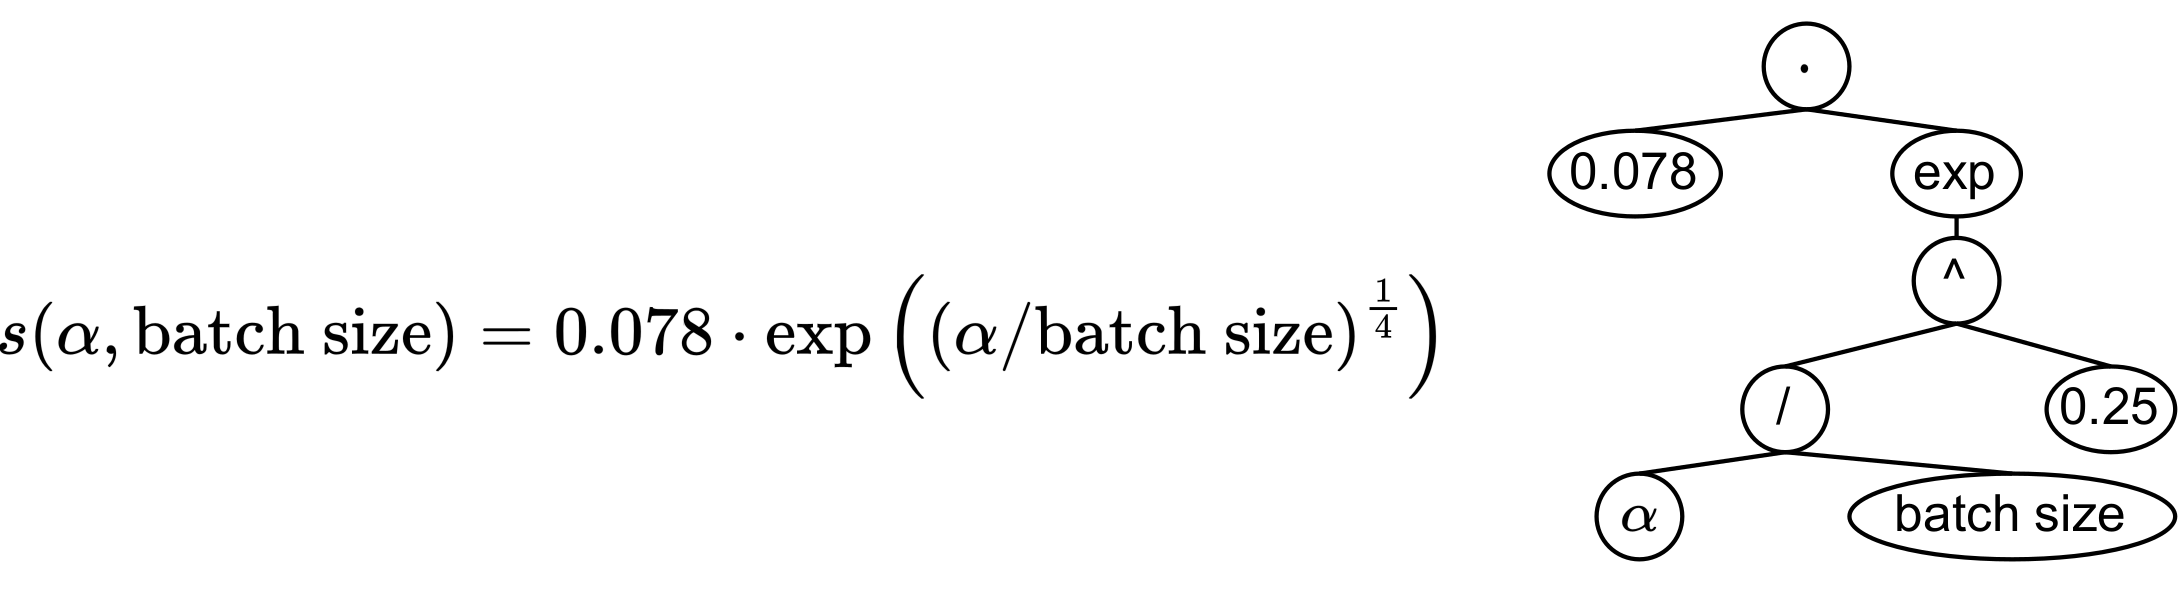
Below you can find an example of a formula obtained by our approach, visualized as an expression tree. The symbolic explanation s expresses how two hyperparameters typical to neural networks, the regularization factor 𝛼 and the batch size, influence the predictive performance of the network.
Paper and Code
We believe that symbolic explanations hold great promise in enhancing the interpretability and understanding of hyperparameter optimization processes. To learn more about the project, please see our paper and our GitHub page. If you have any questions or would like to discuss our research, please feel free to reach out to us!
References
[Augusto and Barbosa, 2000] Augusto, D. and H. Barbosa (2000). “Symbolic Regression via Genetic Programming”. In: Proc. of SBRN’00. IEEE, pp. 173–178.
[Bischl et al., 2023] Bischl, B., M. Binder, M. Lang, T. Pielok, J. Richter, S. Coors, J. Thomas, T. Ullmann, M. Becker, A.-L. Boulesteix, D. Deng, and M. Lindauer (2023). “Hyperparameter Optimization: Foundations, Algorithms, Best Practices, and Open Challenges”. In: Wiley Interdisciplinary Reviews: Data Mining and Knowledge Discovery, e1484.
[Feurer and Hutter, 2019] Feurer, M. and F. Hutter (2019). “Hyperparameter Optimization”. In: Automated Machine Learning: Methods, Systems, Challenges. Ed. by F. Hutter, L. Kotthoff, and J. Vanschoren. Available for free at http://automl.org/book. Springer. Chap. 1, pp. 3–38.
[Hutter et al., 2014] Hutter, F., H. Hoos, and K. Leyton-Brown (2014). “An Efficient Approach for Assessing Hyperparameter Importance”. In: Proc. of ICML’14, pp. 754–762.
[Lindauer et al., 2022] Lindauer, M., K. Eggensperger, M. Feurer, A. Biedenkapp, D. Deng, C. Benjamins, T. Ruhkopf, R. Sass, and F. Hutter (2022). “SMAC3: A Versatile Bayesian Optimization Package for Hyperparameter Optimization”. In: JMLR 23.54, pp. 1–9.
[Moosbauer et al., 2021] Moosbauer, J., J. Herbinger, G. Casalicchio, M. Lindauer, and B. Bischl (2021). “Explaining Hyperparameter Optimization via Partial Dependence Plots”. In: Proc. of NeurIPS’21.
[Pushak and Hoos, 2022] Pushak, Y. and H. Hoos (2022). “AutoML Loss Landscapes”. In: ACM Transactions on Evolutionary Learning and Optimization 2.3, pp. 1–30.
[Schneider et al., 2022] Schneider, L., L. Schäpermeier, R. Prager, B. Bischl, H. Trautmann, and P. Kerschke (2022). “HPO× ELA: Investigating Hyperparameter Optimization Landscapes by Means of Exploratory Landscape Analysis”. In: Proc. of PPSN’22, pp. 575–589.