TL;DR
In our NeurIPS workshop paper , we analyze different performance measures for the evaluation of RNA secondary structure prediction algorithms, showing that commonly used measures are flawed in certain settings. We then propose the Weisfeiler-Lehman graph kernel as a competent measure for performance assessment in the field.
RNA Secondary Structure Prediction
Ribonucleic acid (RNA) is a biological macro-molecule composed of the four nucleotides Adenine, Cytosine, Guanine, and Uracil. It is one of the major regulators in cells and has been connected to multiple diseases like cancer and Parkinson’s. Since the function of RNAs is dominated by their structure, accurate prediction of these structures appears as a fundamental problem in computational biology. RNA folds hierarchically and the formation of the final 3-dimensional shape strongly depends on the formation of a secondary structure, which describes nucleotide pairings (base pairs) of the RNA sequence via hydrogen bonds. The secondary structure already defines the sites for interactions with other cellular compounds, and improvements in secondary structure prediction, therefore, could have a substantial impact on RNA-related research.
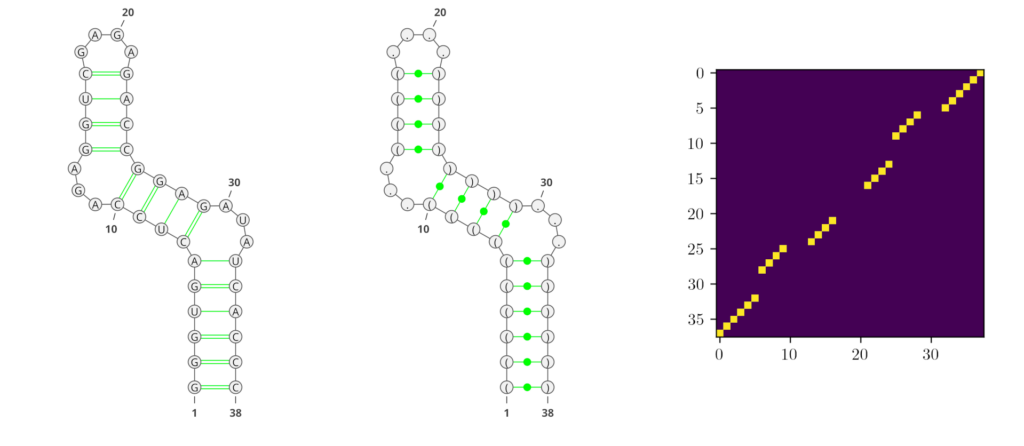
Deep learning (DL) methods recently conquered the field of RNA secondary structure prediction with state-of-the-art results. One advantage of DL methods over more traditional approaches is their ability to predict all kinds of base interactions. Generating an adjacency matrix as output allows these methods to represent a broader repertoire of structural features than using e.g. string representations like the commonly used dot-bracket notation. In Figure 1, we show examples of the different RNA secondary structure representations that are predominantly used in the field.
However, traditional performance measures based on tree-comparison or -alignment methods cannot process all kinds of base pairs. Therefore, the currently most commonly used performance measures for RNA secondary structure prediction are the F1-score and Matthews-Correlation-Coefficient (MCC), both derived from the confusion matrix.
In our latest contribution to the Machine Learning for Structural Biology Workshop at NeurIPS 2023, we scrutinize these metrics, unveiling their limitations through real-world RNA examples. Our work proposes the Weisfeiler-Lehman graph kernel (WL) as a more robust and balanced measure, offering fresh perspectives in evaluating RNA secondary structure predictions. This blog post will explore the advantages of WL, setting a new benchmark in the realm of computational biology.
The Crucial Role of Performance Measures in Algorithm Assessment
In the realm of RNA secondary structure prediction, the effectiveness of algorithms is heavily reliant on the performance measures used for their assessment. To shed light on this, we conducted a comprehensive evaluation of state-of-the-art RNA secondary structure prediction algorithms. Our approach involved applying a range of performance metrics to these algorithms, using a widely recognized benchmark dataset. The objective was to discern any variances in the rankings of these algorithms based on different measures.
Table 1 presents the results of this analysis. A striking observation from our study is the considerable variation in the ranking of algorithms depending on the metric used. For instance, some algorithms that excel under one performance measure may appear less effective when evaluated through a different metric. This discovery underscores a critical aspect of algorithm assessment in computational biology: the choice of performance measure can significantly influence the perceived efficacy of an algorithm.
| Model | F1-Rank | F1-shift-Rank | MCC-Rank | WL-Rank |
|---|---|---|---|---|
| RNAformer | 1 | 1 | 1 | 1 |
| SPOT-RNA | 2 | 3 | 2 | 3 |
| SPOT-RNA2 | 3 | 2 | 4 | 4 |
| RNA-FM | 4 | 3 | 3 | 2 |
| RNAFold | 5 | 4 | 5 | 5 |
| LinearFold-V | 6 | 4 | 6 | 6 |
| ContraFold | 7 | 4 | 7 | 7 |
| pKiss | 8 | 5 | 10 | 9 |
| ipKnot | 9 | 8 | 9 | 10 |
| LinearFold-C | 10 | 7 | 8 | 8 |
| RNAstructure | 11 | 6 | 11 | 11 |
| REDfold | 12 | 9 | 12 | 12 |
This insight is particularly salient for researchers and developers in the field. It suggests that when introducing new algorithms, it’s imperative to consider the selection of performance measures carefully. This not only ensures a more accurate assessment of the algorithm’s capabilities but also provides a more holistic understanding of its performance in diverse scenarios. Thus, our findings advocate for a more nuanced approach to evaluating and reporting the effectiveness of new computational tools in RNA secondary structure prediction.
We note that the RNAformer is a 2D transformer model that we recently proposed in our paper for the 2023 ICML Workshop on Computational Biology, WCB@ICML’23.
WL’s Proficiency in Capturing RNA’s Dynamic Structural Conformations
RNA molecules are renowned for their dynamic nature, often transitioning between multiple structural states. This inherent versatility is pivotal in biological processes, making the ability of performance measures to capture these structural nuances crucial. An intriguing example, illustrated in Figure 2, presents a bi-stable RNA molecule in its two distinct structural states (taken from Wenter et al.). Despite the identical base pair patterns in these states, traditional performance measures like the F1-score and Matthews-Correlation-Coefficient (MCC) fall short in recognizing this similarity.
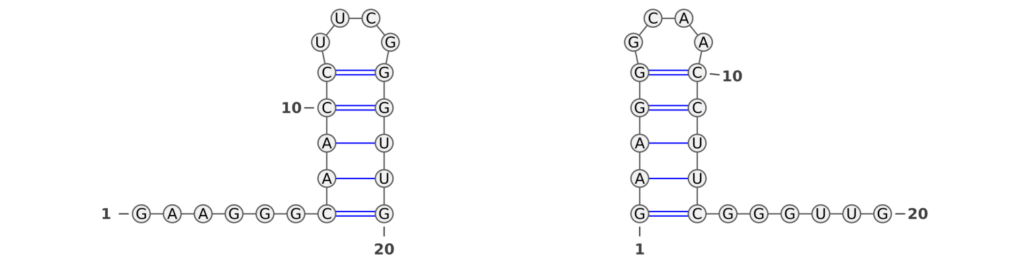
In our analysis, we observed that the F1-score between the two RNA structures was zero, indicating a complete lack of recognition of the shared structural characteristics. This occurs because the F1-score fails to identify similar base pair patterns between the two states. Similarly, the MCC value of -0.026 is unexpectedly low, even lower than what one might anticipate for a random structure. These findings highlight a critical limitation of these conventional metrics: their inability to acknowledge the subtleties of RNA’s structural dynamics.
In stark contrast, the Weisfeiler-Lehman (WL) graph kernel adeptly captures the similarities between these two structures, assigning a score of 0.25. This result is not just a numerical difference; it signifies a profound advancement in our ability to evaluate RNA secondary structures. The WL’s sensitivity to the underlying structural patterns displays its robustness and accuracy.
We note that we recently proposed the first deep learning based algorithm that is capable of predicting multiple structural states for a given RNA sequence using a novel probabilistic transformer architecture. You can read more about this pioneering work in our 2022 NeurIPS paper.
WL’s Ability to Accurately Capture Structural Shifts in RNA
In our pursuit to understand the nuances of performance measures for RNA secondary structure problems, we investigated how the measures respond to structural shifts within RNA molecules. To explore this, we used the 5SrRNA sequence of Drosophila melanogaster as our model. In a controlled experiment, we shifted all base pairs by 1 and 2 positions, as shown in Figure 3. While these shifts are not entirely biologically plausible, they result in structures that are visually similar to the original, making them an excellent test case for evaluating the sensitivity of different performance measures.
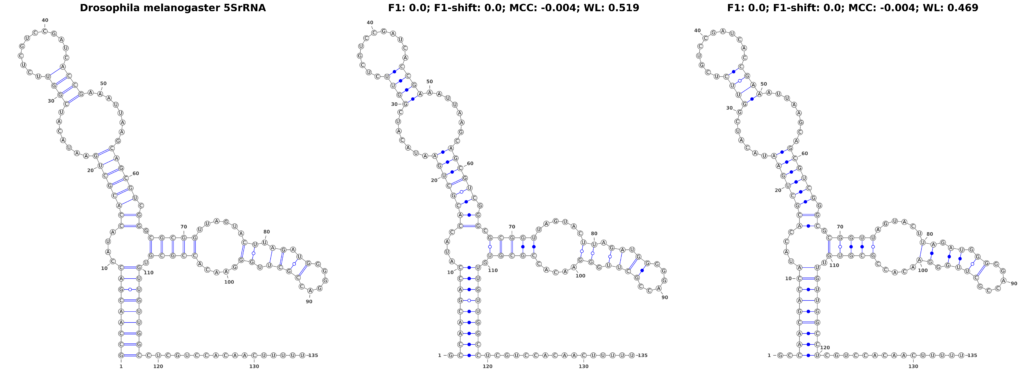
Our findings revealed a stark contrast in the performance of traditional measures compared to the WL graph kernel. The F1-score, when applied to the original and shifted structures, plummeted to zero, suggesting a complete inability to recognize any similarity between the shifted structures. The MCC also underperformed, yielding a score of -0.004, lower than what one might expect for a random structure. Intriguingly, these scores remained consistent regardless of the extent of the shift, highlighting a fundamental limitation in these measures’ ability to detect subtle structural variations.
In sharp contrast, the WL graph kernel demonstrated remarkable proficiency in recognizing these shifts. It assigned scores of 0.519 and 0.469 for the 1- and 2-position shifts, respectively. These scores not only differentiate between the different degrees of shifts but also significantly surpass the traditional metrics in capturing the structural similarities. This ability of the WL to accurately reflect even minor alterations in RNA structure is a groundbreaking advancement, offering a more accurate and nuanced perspective that could greatly enhance computational research in the field.
Leveraging WL’s Capability to Integrate Sequence Information in RNA Analysis
A unique and potent feature of the Weisfeiler-Lehman (WL) graph kernel is its ability to incorporate sequence information into RNA structural analysis.
To showcase this capability, we conducted an experiment using a synthetic riboswitch construct, originally proposed by Wachsmuth et al. We introduced various changes to the underlying RNA sequence to observe how well the WL graph kernel can detect and reflect these modifications. This experiment was designed to test WL’s ability to go beyond mere structural analysis and integrate sequence-level changes.
In our analysis, we found that traditional performance measures like the F1-score and Matthews-Correlation-Coefficient (MCC) were unable to capture these sequence changes. Since they are primarily designed to assess structural conformity, both scores remained at a perfect 1.0 across all different sequences, indicating no change. This is because these metrics do not account for the sequence information — they only evaluate structural alignment.
In stark contrast, the WL graph kernel excelled in this aspect. It not only recognized the changes in the sequence but also quantitatively reflected these variations in its scores. The WL scores varied depending on the extent of the changes introduced, demonstrating its sensitivity to both structural and sequence-level alterations. This feature is displayed in Figure 4, where the structures are accompanied by their respective scores, visibly demonstrating the kernel’s ability to factor in sequence information.
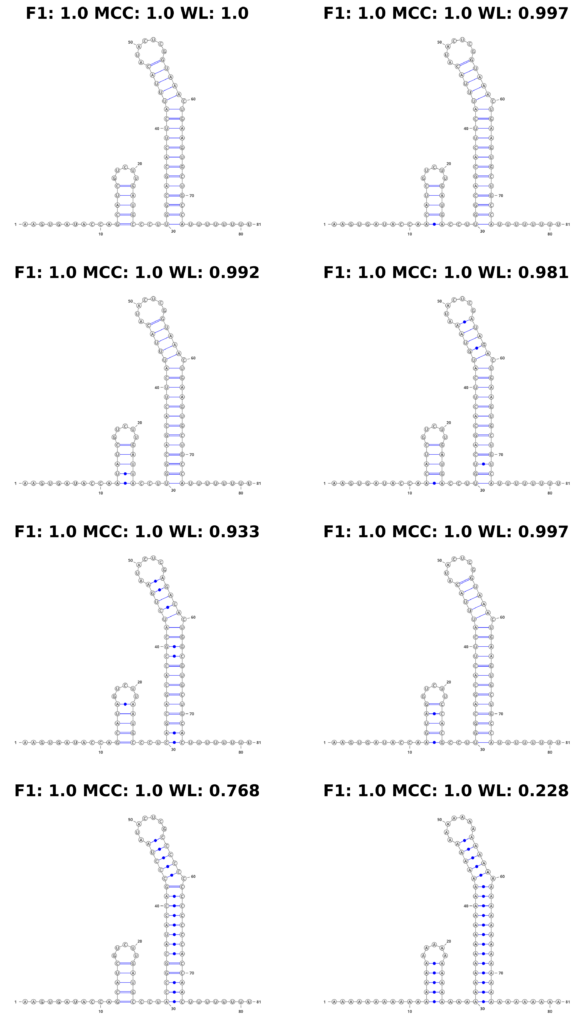
Figure 4: Mutation Example. We show an example of a simulated mutation process on a synthetic theophylline riboswitch construct proposed by Wachsmuth et al. Top left shows the original construct. With each step (left to right, top to bottom), we introduce the following mutations: 1 base pair (bp) mutated, 2 bp, 4 bp, 8 bp, entire first stem, entire second stem, entire sequence to ’A’.
The implications of this are profound for RNA research. The WL graph kernel’s ability to incorporate sequence data into its analysis opens new avenues for understanding RNA behavior, particularly in scenarios where sequence variations play a critical role. It means that the WL is not just assessing structural conformity, but also capturing the nuances of RNA sequence changes, making it an invaluable tool for more comprehensive RNA secondary structure evaluations.
WL Improves RNA Design Performance

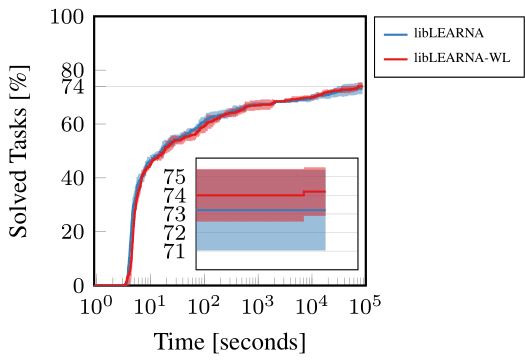
Figure 5: RNA Design guided by Hamming distance (libLEARNA) or WL (libLEARNA-WL).
You can read more about our work on RNA design in our recent paper for the 2023 ICML Workshop on Computational Biology, WCB@ICML’23, and our ICLR’19 paper on AutoRL for RNA design.
Conclusion
Our research presented at the NeurIPS workshop underscores a fundamental but often overlooked aspect of computational biology: the critical importance of selecting the right performance measures for algorithm evaluation. Through our analysis, we have highlighted significant flaws in the widely used F1-score and Matthews-Correlation-Coefficient (MCC) for RNA secondary structure prediction. In their place, we advocate for the adoption of the Weisfeiler-Lehman (WL) graph kernel, a novel approach in this domain, for a more accurate and comprehensive performance assessment.
The superiority of the WL graph kernel in capturing the nuances of RNA structures, including dynamic conformational changes and sequence information, marks a significant departure from traditional methods. This innovation not only challenges the status quo but also sets a new benchmark for algorithmic assessment in RNA structure prediction.
Looking ahead, the implications of our findings extend beyond the confines of RNA structure prediction. The potential limitations and misleading properties of traditional performance measures in other areas of computational biology and beyond warrant further investigation. This opens a plethora of opportunities for future research, inviting a broader reevaluation of performance measures across various disciplines. By doing so, we can enhance the accuracy and efficacy of algorithmic assessments, leading to more robust and reliable research outcomes in the vast field of computational sciences.
For more information on our work in the field of RNA folding and design, we again refer to our 2022 NeurIPS paper on the ProbTransformer, our work on the RNAformer for the 2023 ICML Workshop on Computational Biology, our RNA design paper on libLEARNA for the 2023 ICML Workshop on Computational Biology and the ICLR’19 paper on LEARNA with the corresponding blog post.